Subscribe

RSS Feed (xml)

Powered By

Skin Design:
Free Blogger Skins

Powered by Blogger

Friday, June 6, 2008

article : Plant Life Histories: Ecology, Phylogeny and Evolution. - book reviews

Ecology, Sept, 1998 by Gregory P. Cheplick

Silvertown, Jonathan W., Miguel Franco, and John L. Harper, editors. 1997. Cambridge University Press, New York. xviii + 313 p. $29.95, ISBN: 0-521-57495-1.

Plant ecologists often attempt to make broad, sweeping generalizations regarding the relationships between life history features and various components of the abiotic environment (e.g., correlations between seed mass and habitat dryness). The objective is to unravel the selection pressures thought to have led to the evolution of the life history trait of interest. In such analyses that ignore phylogeny, life history measurements for different species are assumed to represent statistically independent data points and therein lies a problem, as the papers in this volume make abundantly clear.

This collection of papers revolves around the common theme of using phylogenetically independent contrasts (PICs) to "re-examine in phylogenetic perspective the perceived patterns of relationship between different plant life history traits, and between those traits and the presumed selective pressures that shape them." For their phylogenies, a fair number of the papers rely on Chase et al. (1993; Phylogenetics of seed plants: an analysis of nucleotide sequences from the plastid gene rbcL. Annals of the Missouri Botanical Garden 80:528580). In actuality, not all authors take the phylogenetic approach and some seem to be unaware of the general theme. Nevertheless, there is much material worth recommending, including the several papers that do not utilize a phylogenetic approach.

The fifteen contributions are organized into five sections. The three chapters in the first section on "Phylogenetic perspectives" adhere closely to the general theme. It is remarkable how well several generally accepted life history correlations, originally established without reference to phylogeny, hold up when phylogeny is controlled. For example, J. Silvertown and M. Dodd show that reproductive allocation is indeed higher in annuals than in perennials, and higher in early-successional perennials than in late-successional perennials, even when phylogenetically controlled tests are used. In their comparison of native and alien floras of the British Isles, M. J. Crawley et al. stress how aliens and natives are not drawn from species pools with similar taxonomic compositions, making a phylogenetically-controlled approach essential to the espousal of any generalizations.

The second and third sections deal with "Reproductive traits" and "Seeds," respectively. The papers cover mating systems, including selfing (S. C. H. Barrett et al. and D. J. Schoen et al.), genetic diversity (J. L. Hamrick and M. J. W. Godt), seed size in relation to dormancy (M. Rees) and dispersal (M. Westoby et al.), and a mathematically intense theory of packaging and provisioning in plant reproduction (D. L. Venable). Most of the contributions are of high quality and provide an excellent introduction to the recent literature as well as some new insights. Barrett et al. show how selfing has repeatedly evolved as a reproductive assurance mechanism in lineages of annual Polemoniaceae, while Schoen et al. use theoretical and experimental approaches to determine the relative importance of automatic selection and reproductive assurance in the evolution of self-pollination. The relation of seed mass to life history is explored in two chapters. Using comparative methods, Rees shows how tall, long-lived plants with animal-dispersed seeds tend to have heavier seeds than species with extensive lateral spread or species with long-lived seed banks. In an interesting twist, Westoby et al. question the assumptions underlying the phylogenetic approach, but use PICs to show an unexplained inverse correlation between seed mass and specific leaf area.

The fourth section, on "Recruitment and growth," includes an interesting comparative analysis of clonal plant associations with habitat features that reveals that clonality is more abundant under "wet, cold and unproductive circumstances" (J. M. van Groenendael et al.), a comparative study of life history variation (M. Franco and J. Silvertown), and a rather misplaced review of life history evolutionary theory by an animal ecologist (R. M. Sibly) that considers neither recruitment, growth, or phylogeny.

Two chapters in the final section ("Interactions") use phylogeny to address host-plant choices in insect-plant interactions (D. J. Futuyma and C. Mitter) and evolutionary trends in root-microbe symbioses (A. H. Fitter and B. Moyersoen). Although the final chapter does not specifically utilize a phylogenetic approach, it clarifies current definitions of "competitive ability" and explores how competitive hierarchies depend on environment (D. E. Goldberg).

In short, this affordable volume serves as an excellent introduction to the usefulness of PICs and related phylogenetic tools in advancing our present understanding of plant life history evolution. The phylogenetic perspective may indeed, as the editors maintain in the Preface, provide the means to address the important question of how general the observed trait correlations ofttimes reported by ecologists actually are. The book is relatively free of typographical errors, contains clear graphics, and appears to have been well-edited. Graduate students in both ecology and systematics who are interested in the grand questions of how and why adaptive traits have evolved in plants can find ideas for research in this volume. Many of the authors should be commended for helping to unite two groups in plant biology that all-too-often carry out their respective research programs in relative isolation: systematists and population ecologists. Clearly, researchers in these disciplines can find commonalities in the phylogenetic approach advocated by the editors to questions regarding adaptation and evolution.

Read More......

article : Phylogenetic tree in Knowledge

Fig. 1: A speculatively rooted tree for rRNA genes

A phylogenetic tree, also called an evolutionary tree, is a tree showing the evolutionary relationships among various biological species or other entities that are believed to have a common ancestor. In a phylogenetic tree, each node with descendants represents the most recent common ancestor of the descendants, and the edge lengths in some trees correspond to time estimates. Each node is called a taxonomic unit. Internal nodes are generally called hypothetical taxonomic units (HTUs) as they cannot be directly observed.


History

Although the idea of a "tree of life" arose from ancient notions of a ladder-like progression from lower to higher forms of life (such as in the Great Chain of Being), Charles Darwin (1859) first illustrated and popularized the notion of an evolutionary "tree" in his seminal book The Origin of Species. Over a century later, evolutionary biologists still use tree diagrams to depict evolution because the floral analogy effectively conveys the concept that speciation occurs through the adaptive and random splitting of lineages. Over time, species classification has become less static and more dynamic.

Adolf Engler (1844 - 1930) and Karl A. E. Prantl (1849 - 1893) published a system of plant classification in their monograph Die Natürlichen Pflanzenfamilien. In it, they arranged the families and orders of flowering plants on the basis of complexity of floral morphology. Characters like a perianth with one whorl, unisexual flowers and pollination by wind were considered primitive as compared to perianth with two whorls, bisexual flowers and pollination by insects.[1]

The plant kingdom is further divided into divisions, sub-divisions, classes, orders and families. According to this system, monocotyledons are considered more primitive than dicotyledons. It also considers evolution of angiosperms from a single source and the sequence of orders and families show parallel evolution.

Types

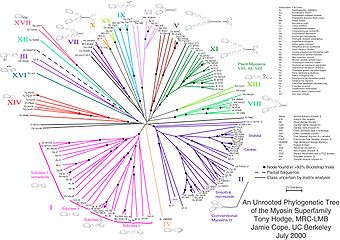
Fig. 1: Unrooted tree of the myosin supergene family
Fig. 1: Unrooted tree of the myosin supergene family[2]
Fig. 2: A highly resolved, automatically generated Tree Of Life, based on completely sequenced genomes .
Fig. 2: A highly resolved, automatically generated Tree Of Life, based on completely sequenced genomes [3][4].
A phylogenetic tree, showing how Eukaryota and Archaea are more closely related to each other than to Bacteria, based on Cavalier-Smith's theory of bacterial evolution.

A rooted phylogenetic tree is a directed tree with a unique node corresponding to the (usually imputed) most recent common ancestor of all the entities at the leaves of the tree. The most common method for rooting trees is the use of an uncontroversial outgroup — close enough to allow inference from sequence or trait data, but far enough to be a clear outgroup.

Unrooted trees illustrate the relatedness of the leaf nodes without making assumptions about common ancestry. While unrooted trees can always be generated from rooted ones by simply omitting the root, a root cannot be inferred from an unrooted tree without some means of identifying ancestry; this is normally done by including an outgroup in the input data or introducing additional assumptions about the relative rates of evolution on each branch, such as an application of the molecular clock hypothesis. Figure 1 depicts an unrooted phylogenetic tree for myosin, a superfamily of proteins.[5]

Both rooted and unrooted phylogenetic trees can be either bifurcating or multifurcating, and either labeled or unlabeled. A bifurcating tree has a maximum of two descendants arising from each interior node, while a multifurcating tree may have more than two. A labeled tree has specific values assigned to its leaves, while an unlabeled tree, sometimes called a tree shape, only defines a topology. The number of possible trees for a given number of leaf nodes depends on the specific type of tree, but there are always more multifurcating than bifurcating trees, more labeled than unlabeled trees, and more rooted than unrooted trees. The last distinction is the most biologically relevant; it arises because there are many places on an unrooted tree to put the root. For labeled bifurcating trees, there are

\frac{(2n-3)!}{2^{n-2}(n-2)!}

total rooted trees and

\frac{(2n-5)!}{2^{n-3}(n-3)!}

total unrooted trees, where n represents the number of leaf nodes. The number of unrooted trees for n input sequences or species is equal to the number of rooted trees for n-1 sequences.[6]

A dendrogram is a broad term for the diagrammatic representation of a phylogenetic tree.

A cladogram is a tree formed using cladistic methods. This type of tree only represents a branching pattern, i.e., its branch lengths do not represent time.

A phylogram is a phylogenetic tree that explicitly represents number of character changes through its branch lengths.

An ultrametric tree or chronogram is a phylogenetic tree that explicitly represents evolutionary time through its branch lengths.

Construction

Phylogenetic trees among a nontrivial number of input sequences are constructed using computational phylogenetics methods. Distance-matrix methods such as neighbor-joining or UPGMA, which calculate genetic distance from multiple sequence alignments, are simplest to implement, but do not invoke an evolutionary model. Many sequence alignment methods such as ClustalW also create trees by using the simpler algorithms (i.e. those based on distance) of tree construction. Maximum parsimony is another simple method of estimating phylogenetic trees, but implies an implicit model of evolution (i.e. parsimony). More advanced methods use the optimality criterion of maximum likelihood, often within a Bayesian Framework, and apply an explicit model of evolution to phylogenetic tree estimation.[6] Identifying the optimal tree using many of these techniques is NP-hard[6], so heuristic search and optimization methods are used in combination with tree-scoring functions to identify a reasonably good tree that fits the data.

Tree-building methods can be assessed on the basis of several criteria:[7]

  • efficiency (how long does it take to compute the answer, how much memory does it need?)
  • power (does it make good use of the data, or is information being wasted?)
  • consistency (will it converge on the same answer repeatedly, if each time given different data for the same model problem?)
  • robustness (does it cope well with violations of the assumptions of the underlying model?)
  • falsifiability (does it alert us when it is not good to use, i.e. when assumptions are violated?)

Tree-building techniques have also gained the attention of mathematicians. Trees can also be built using T-theory. [8]

Limitations

Although phylogenetic trees produced on the basis of sequenced genes or genomic data in different species can provide evolutionary insight, they have important limitations. They do not necessarily accurately represent the species evolutionary history. The data on which they are based is noisy; the analysis can be confounded by horizontal gene transfer[9], hybridisation between species that were not nearest neighbors on the tree before hybridisation takes place, convergent evolution, and conserved sequences. To avoid these limitations, one method of analysis, implemented in the program PhyloCode,[verification needed] does not assume a tree structure.

Also, there are problems in basing the analysis on a single type of character, such as a single gene or protein or only on morphological analysis, because such trees constructed from another unrelated data source often differ from the first, and therefore great care is needed in inferring phylogenetic relationships among species. This is most true of genetic material that is subject to lateral gene transfer and recombination, where different haplotype blocks can have different histories. In general, the output tree of a phylogenetic analysis is an estimate of the character's phylogeny (i.e. a gene tree) and not the phylogeny of the taxa (i.e. species tree) from which these characters were sampled, though ideally, both should be very close.

When extinct species are included in a tree, they are terminal nodes, as it is unlikely that they are direct ancestors of any extant species. Scepticism must apply when extinct species are included in trees that are wholly or partly based on DNA sequence data, due to the fact that little useful "ancient DNA" is preserved for longer than 100,000 years, and except in the most unusual circumstances no DNA sequences long enough for use in phylogenetic analyses have yet been recovered from material over 1 million years old.

In some organisms, endosymbionts have an independent genetic history from the host.

Phylogenetic networks are used when bifurcating trees are not suitable, due to these complications which suggest a more reticulate evolutionary history of the organisms sampled.

http://wikipedia.org

Read More......

article : What the Systematics

Biological systematics is the study of the diversity of life on the planet Earth, both past and present, and the relationships among living things through time. Relationships are visualized as evolutionary trees (synonyms: cladograms, phylogenetic trees, phylogenies). Phylogenies have two components, branching order (showing group relationships) and branch length (showing amount of evolution). Phylogenetic trees of species and higher taxa are used to study the evolution of traits (e.g., anatomical or molecular characteristics) and the distribution of organisms (biogeography). Systematics, in other words, is used to understand the evolutionary history of life on Earth.

A comparison of phylogenetic and phenetic concepts

The term "systematics" is sometimes used synonymously with "taxonomy" and may be confused with "scientific classification." However, taxonomy is properly the describing, identifying, classifying, and naming of organisms, while "classification" is focused on placing organisms within groups that show their relationships to other organisms. All of these biological disciplines can be involved with extinct and extant organisms. However, systematics alone deals specifically with relationships through time, requiring recognition of the fossil record when dealing with the systematics of organisms.

Systematics uses taxonomy as a primary tool in understanding organisms, as nothing about an organism's relationships with other living things can be understood without it first being properly studied and described in sufficient detail to identify and classify it correctly. Scientific classifications are aids in recording and reporting information to other scientists and to laymen. The systematist, a scientist who specializes in systematics, must, therefore, be able to use existing classification systems, or at least know them well enough to skillfully justify not using them.

Phenetic systematics was an attempt to determine the relationships of organisms through a measure of similarity, considering plesiomorphies (ancestral traits) and apomorphies (derived traits) to be equally informative. From the 20th century onwards, it was superseded by cladistics, which considers plesiomorphies to be uninformative for an attempt to resolve the phylogeny of Earth's various organisms through time. Today's systematists generally make extensive use of molecular biology and computer programs to study organisms.

Systematics is fundamental to biology because it is the foundation for all studies of organisms, by showing how any organism relates to other living things.

Systematics is also of major importance in understanding conservation issues because it attempts to explain the Earth's biodiversity and could be used to assist in allocating limited means to preserve and protect endangered species, by looking at, for example, the genetic diversity among various taxa of plants or animals and deciding how much of that it is necessary to preserve.

http://wikipedia.org

Read More......

article : Know the Molecular phylogeny

Molecular phylogeny, also known as molecular systematics, is the use of the structure of molecules to gain information on an organism's evolutionary relationships. The result of a molecular phylogenetic analysis is expressed in a so-called phylogenetic tree.

Techniques and applications

Every living organism contains DNA, RNA, and proteins. Closely related organisms generally have a high degree of agreement in the molecular structure of these substances, while the molecules of organisms distantly related usually show a pattern of dissimilarity. Molecular phylogeny uses such data to build a "relationship tree" that shows the probable evolution of various organisms. Not until recent decades, however, has it been possible to isolate and identify these molecular structures.

One application of molecular phylogeny is in DNA barcoding, where the species of an individual organism is identified using small sections of mitochondrial DNA. Another application of the techniques that make this possible can be seen in the very limited field of human genetics, such as the ever more popular use of genetic testing to determine a child's paternity, as well as the emergence of a new branch of criminal forensics focused on evidence known as genetic fingerprinting.

The effect on traditional biological classification schemes in the biological sciences has been dramatic as well. Work that was once immensely labor- and materials-intensive can now be done quickly and easily, leading to yet another source of information becoming available for systematic and taxonomic appraisal. This particular kind of data has become so popular that taxonomical schemes based solely on molecular data may be encountered.

Theoretical background

Early attempts at molecular systematics were also termed as chemotaxonomy and made use of proteins, enzymes, carbohydrates and other molecules which were separated and characterized using techniques such as chromatography. These have been largely replaced in recent times by DNA sequencing which produces the exact sequences of nucleotides or bases in either DNA or RNA segments extracted using different techniques. These are generally considered superior for evolutionary studies since the actions of evolution are ultimately reflected in the genetic sequences. At present it is still a long and expensive process to sequence the entire DNA of an organism (its genome), and this has been done for only a few species. However it is quite feasible to determine the sequence of a defined area of a particular chromosome. Typical molecular systematic analyses require the sequencing of around 1000 base pairs. At any location within such a sequence, the bases found in a given position may vary between organisms. The particular sequence found in a given organism is referred to as its haplotype. In principle, since there are four base types, with 1000 base pairs, we could have 41000 distinct haplotypes. However, for organisms within a particular species or in a group of related species, it has been found empirically that only a minority of sites show any variation at all and most of the variations that are found are correlated, so that the number of distinct haplotypes that are found is relatively small.

In a molecular systematic analysis, the haplotypes are determined for a defined area of genetic material; ideally a substantial sample of individuals of the target species or other taxon are used however many current studies are based on single individuals. Haplotypes of individuals of closely related, but supposedly different, taxa are also determined. Finally, haplotypes from a smaller number of individuals from a definitely different taxon are determined: these are referred to as an out group. The base sequences for the haplotypes are then compared. In the simplest case, the difference between two haplotypes is assessed by counting the number of locations where they have different bases: this is referred to as the number of substitutions (other kinds of differences between haplotypes can also occur, for example the insertion of a section of nucleic acid in one haplotype that is not present in another). Usually the difference between organisms is re-expressed as a percentage divergence, by dividing the number of substitutions by the number of base pairs analysed: the hope is that this measure will be independent of the location and length of the section of DNA that is sequenced.

An older and superseded approach was to determine the divergences between the genotypes of individuals by DNA-DNA hybridisation. The advantage claimed for using hybridisation rather than gene sequencing was that it was based on the entire genotype, rather than on particular sections of DNA. Modern sequence comparison techniques overcome this objection by the use of multiple sequences.

Once the divergences between all pairs of samples have been determined, the resulting triangular matrix of differences is submitted to some form of statistical cluster analysis, and the resulting dendrogram is examined in order to see whether the samples cluster in the way that would be expected from current ideas about the taxonomy of the group, or not. Any group of haplotypes that are all more similar to one another than any of them is to any other haplotype may be said to constitute a clade. Statistical techniques such as bootstrapping and jackknifing

help in providing reliability estimates for the positions of haplotypes within the evolutionary trees.

Characteristics and assumptions of molecular systematics

This example illustrates several characteristics of molecular systematics and its underlying assumptions.

  1. Molecular systematics is an essentially cladistic approach: it assumes that classification must correspond to phylogenetic descent, and that all valid taxa must be monophyletic.
  2. Molecular systematics often uses the molecular clock assumption that quantitative similarity of genotype is a sufficient measure of the recency of genetic divergence. Particularly in relation to speciation, this assumption could be wrong if either
    1. some relatively small genotypic modification acted to prevent interbreeding between two groups of organisms, or
    2. in different subgroups of the organisms being considered, genetic modification proceeded at different rates.
  3. In animals, it is often convenient to use mitochondrial DNA for molecular systematic analysis. However, because in mammals mitochondria are inherited only from the mother, this is not fully satisfactory, because inheritance in the paternal line might not be detected: in the example above, Vilà et al cite more limited studies with chromosomal DNA that support their conclusions.

These characteristics and assumptions are not wholly uncontroversial among biological systematists. As a cladistic method, molecular systematics is open to the same criticisms as cladistics in general. It can also be argued that it is a mistake to replace a classification based on visible and ecologically relevant characteristics by one based on genetic details that may not even be expressed in the phenotype. However the molecular approach to systematics, and its underlying assumptions, are gaining increasing acceptance. As gene sequencing becomes easier and cheaper, molecular systematics is being applied to more and more groups, and in some cases is leading to radical revisions of accepted taxonomies.

History of molecular phylogeny

Further information: History of molecular evolution

Molecular systematics was pioneered by Charles G. Sibley (birds), Herbert C. Dessauer (herpetology), and Morris Goodman (primates), followed by Allan C. Wilson, Robert K. Selander, and John C. Avise (who studied various groups). Work with protein electrophoresis began around 1956. Although the results were not quantitative and did not initially improve on morphological classification, they provided tantalizing hints that long-held notions of the classifications of birds, for example, needed substantial revision. In the period of 1974–1986, DNA-DNA hybridization was the dominant technique.[1]

http://wikipedia.org

Read More......

article : Learn more about Phylogenetics

Phylogenetic groups, or taxa, can be monophyletic, paraphyletic, or polyphyletic.

In biology, phylogenetics (Greek: phyle = tribe, race and genetikos = relative to birth, from genesis = birth) is the study of evolutionary relatedness among various groups of organisms (e.g., species, populations). Also known as phylogenetic systematics or cladistics, phylogenetics treats each species as a group of lineage-connected individuals[1]. Taxonomy, the classification of organisms according to similarity, has been richly informed by phylogenetics but remains methodologically and logically distinct.[2]

Evolution is regarded as a branching process, whereby populations are altered over time and may speciate into separate branches, hybridize together, or terminate by extinction. This may be visualized as a multidimensional character-space that a population moves through over time. The problem posed by phylogenetics is that genetic data are only available for the present, and fossil records (osteometric data) are sporadic and less reliable. Our knowledge of how evolution operates is used to reconstruct the full tree.[3]

Cladistics provides a simplified method of understanding phylogenetic trees. There are some terms that describe the nature of a grouping. For instance, all birds and reptiles are believed to have descended from a single common ancestor, so this taxonomic grouping (yellow in the diagram) is called monophyletic. "Modern reptile" (cyan in the diagram) is a grouping that contains a common ancestor, but does not contain all descendents of that ancestor (birds are excluded). This is an example of a paraphyletic group. A grouping such as warm-blooded animals would include only mammals and birds (red/orange in the diagram) and is called polyphyletic

because the members of this grouping do not include the most recent common ancestor.

The most commonly used methods to infer phylogenies include parsimony, maximum likelihood, and MCMC-based Bayesian inference. Distance-based methods construct trees based on overall similarity which is often assumed to approximate phylogenetic relationships. All methods depend upon an implicit or explicit mathematical model describing the evolution of characters observed in the species included, and are usually used for molecular phylogeny where the characters are aligned nucleotide or amino acid sequences.

Ernst Haeckel's recapitulation theory

During the late 19th century, Ernst Haeckel's recapitulation theory, or biogenetic law, was widely accepted. This theory was often expressed as "ontogeny recapitulates phylogeny", i.e. the development of an organism exactly mirrors the evolutionary development of the species. Haeckel's early version of this hypothesis (that the embryo mirrors adult evolutionary ancestors) has since been rejected, and the hypothesis amended as the embryo's development mirroring embryos of its evolutionary ancestors. Most modern biologists recognize numerous connections between ontogeny and phylogeny, explain them using evolutionary theory, or view them as supporting evidence for that theory. Donald Williamson suggested that larvae and embryos represented adults in other taxa that have been transferred by hybridization (the larval transfer theory)[4] [5]

Gene transfer

Organisms can generally inherit genes in two ways: from parent to offspring (vertical gene transfer), or by horizontal or lateral gene transfer, in which genes jump between unrelated organisms, a common phenomenon in prokaryotes.

Lateral gene transfer has complicated the determination of phylogenies of organisms since inconsistencies have been reported depending on the gene chosen.

Carl Woese came up with the three-domain theory of life (eubacteria, archaea and eukaryotes) based on his discovery that the genes encoding ribosomal RNA are ancient and distributed over all lineages of life with little or no lateral gene transfer. Therefore rRNA are commonly recommended as molecular clocks for reconstructing phylogenies.

This has been particularly useful for the phylogeny of microorganisms, to which the species concept does not apply and which are too morphologically simple to be classified based on phenotypic traits.

Taxon sampling and phylogenetic signal

Owing to the development of advanced sequencing techniques in molecular biology, it has become feasible to gather large amounts of data (DNA or amino acid sequences) to estimate phylogenies. For example, it is not rare to find studies with character matrices based on whole mitochondrial genomes. However, it has been proposed that it is more important to increase the number of taxa in the matrix than to increase the number of characters, because the more taxa, the more robust is the resulting phylogeny. This is partly due to the breaking up of long branches. It has been argued that this is an important reason to incorporate data from fossils into phylogenies where possible. Using simulations, Derrick Zwickl and Hillis[6] found that increasing taxon sampling in phylogenetic inference has a positive effect on the accuracy of phylogenetic analyses.

Another important factor that affects the accuracy of tree reconstruction is whether the data analyzed actually contain useful phylogenetic signal, a term that is used generally to denote whether related organisms tend to resemble each other with respect to their genetic material or phenotypic traits.[7]

http://wikipedia.org

Read More......

Phylogenetic Analysis of Particle-Attached and Free-Living Bacterial Communities in the Columbia River, Its Estuary, and the Adjacent Coastal Ocean

Applied and Environmental Microbiology, July 1999, p. 3192-3204, Vol. 65, No. 7
0099-2240/99/$04.00+0
Copyright © 1999, American Society for Microbiology. All rights reserved.


Byron C. Crump,* E. Virginia Armbrust, and John A. Baross

School of Oceanography, University of Washington, Seattle, Washington 98195

Received 15 December 1998/Accepted 3 May 1999

The Columbia River estuary is a dynamic system in which estuarine turbidity maxima trap and extend the residence time of particles and particle-attached bacteria over those of the water and free-living bacteria. Particle-attached bacteria dominate bacterial activity in the estuary and are an important part of the estuarine food web. PCR-amplified 16S rRNA genes from particle-attached and free-living bacteria in the Columbia River, its estuary, and the adjacent coastal ocean were cloned, and 239 partial sequences were determined. A wide diversity was observed at the species level within at least six different bacterial phyla, including most subphyla of the class Proteobacteria. In the estuary, most particle-attached bacterial clones (75%) were related to members of the genus Cytophaga or of the alpha , gamma , or delta subclass of the class Proteobacteria. These same clones, however, were rare in or absent from either the particle-attached or the free-living bacterial communities of the river and the coastal ocean. In contrast, about half (48%) of the free-living estuarine bacterial clones were similar to clones from the river or the coastal ocean. These free-living bacteria were related to groups of cosmopolitan freshwater bacteria (beta -proteobacteria, gram-positive bacteria, and Verrucomicrobium spp.) and groups of marine organisms (gram-positive bacteria and alpha -proteobacteria [SAR11 and Rhodobacter spp.]). These results suggest that rapidly growing particle-attached bacteria develop into a uniquely adapted estuarine community and that free-living estuarine bacteria are similar to members of the river and the coastal ocean microbial communities. The high degree of diversity in the estuary is the result of the mixing of bacterial communities from the river, estuary, and coastal ocean.


* Corresponding author. Mailing address: School of Oceanography, University of Washington, Seattle, WA 98195. Phone: (206) 543-0147. Fax: (206) 543-0275. E-mail: bcrump@u.washington.edu.

Read More......

Search by Google

Custom Search
 

Search Engine Optimization - AddMe

Enter your email address:

Delivered by FeedBurner